
RUCKUS Analytics
Robust reporting, informative dashboards and machine-learning-powered analytics for RUCKUS enterprise networks
RUCKUS Analytics
Get a Quote Request a Free Trial
RUCKUS Analytics Benefits:
- Delivers comprehensive network intelligence powered by machine learning
- Helps you meet your network SLAs
- Accelerates client and network troubleshooting for faster resolution of service issues
- Gives you the power to drill down from summary views to the most granular detail
- Scales to fit the largest deployments, with effortless capacity expansion
RUCKUS Analytics Subscription for 1 AP
Our Price: Request a Quote
RUCKUS Analytics Subscription for 1 AP
Our Price: Request a Quote
RUCKUS Analytics Subscription for 1 AP
Our Price: Request a Quote
RUCKUS Analytics Subscription for 1 AP
Our Price: Request a Quote
RUCKUS Analytics Subscription for 1 AP
Our Price: Request a Quote
RUCKUS Analytics Subscription for 1 AP
Our Price: Request a Quote
Overview:
IT teams often lack the tools to ensure required network service levels in an environment of ever-increasing user connectivity demands and network complexity. Helpdesk tickets from user connectivity issues pile up while IT struggles to glean insight from network data. When service issues affect user experience, IT often lacks a way to identify root causes and define a course of action to fix the problem.
RUCKUS Analytics from CommScope is a cloud service that delivers robust reporting, informative dashboards and machine-learning-powered analytics for your RUCKUS network. The service aggregates raw data and automatically transforms it into meaningful insight into network operations. Machine-learningpowered analytics free you from manually reviewing network data and let you focus on other projects. Comprehensive network intelligence helps you to deliver on network service level agreements in support of users, devices and applications.
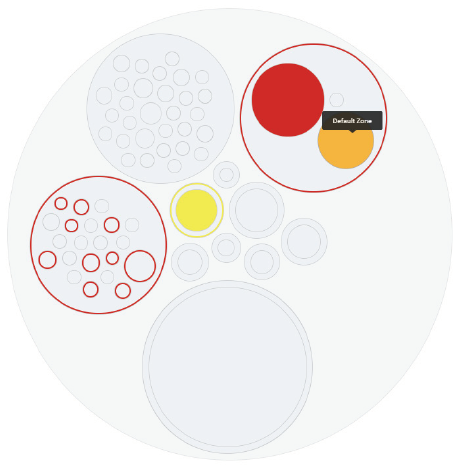
This detail from the main dashboard shows a circle packing chart. It provides a
graphical representation
of the network hierarchy, with color coding that indicates where network incidents have occurred. You can
easily zoom in for a closer view by double clicking on an area of the chart.
The service scales to support the largest deployments, expanding capacity transparently to meet your requirements. RUCKUS Analytics supports SmartZone™ 5.1.2 and higher.
RUCKUS Analytics has an industry-unique combination of attributes:
- Automated data baselining and machine-learning-driven insights
- Health and SLA monitoring
- Powerful, holistic troubleshooting
- Automatic classification of incident severity
- No requirement for an on-site data collector or overlay sensors
- Granular access to raw data with deep exploration and custom dashboards
- 12 months of storage with flexible data reporting
Features:
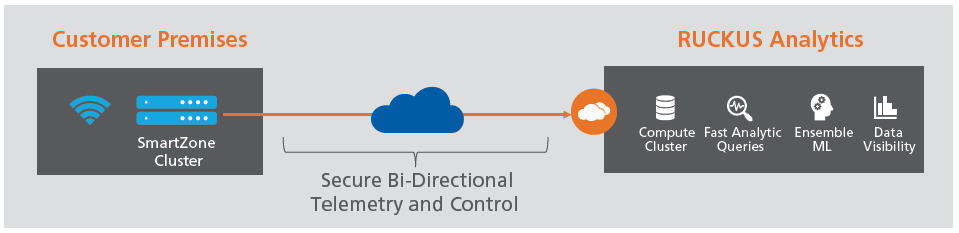
Streaming Telemetry with a Modern Data Stack for Advanced Analytics
RUCKUS Analytics is designed for the unique data profile generated by network devices. On-premises controllers securely connect to the cloud and stream lightweight health KPIs and telemetry. The high-performance data stack ingests and processes the data to serve as the basis for queries, reports and baseline metrics.
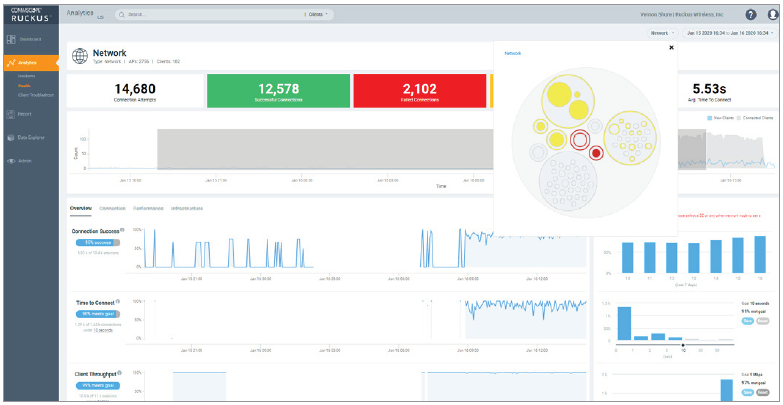
Network Health Monitoring
The service lets you easily monitor network health, with an overview tab that provides a high-level summary view. Select other health monitoring tabs to view metrics in specific health categories: connection, performance and infrastructure. Network health monitoring gives you instant visibility into metrics like AP service uptime, time to connect, connection success rate, client throughput and more. You define the service levels that you want to measure against. For example, you might want to set the "time to connect" goal at five seconds-RUCKUS Analytics will tell you what percentage of the time the network meets that goal. The service lets you not only monitor-but also readily demonstrate to others in your organization-performance to SLAs.
Network health monitoring automatically tracks how your network
is performing relative to SLA thresholds
that you set across a variety
of measures in three categories: connection, performance and
infrastructure.
Incident Analytics Powered by Machine Learning
RUCKUS Analytics enables machine-assisted proactive networking for your RUCKUS deployment. It automatically establishes a normal range of behavior for each network element, without requiring any input from IT. Then it uses machine learning to automatically identify service incidents related to connectivity, performance and infrastructure that affect user experience. IT administrators can view incidents by type, severity and impact.
The system provides details for each incident including:
- Root cause and recommended action
- Affected areas (client operating system types, access point models, firmware versions, WLANs and more)
- Other impact details, including severity, client impact and duration
- List of impacted clients
- Presentation of the underlying data that drives the incident
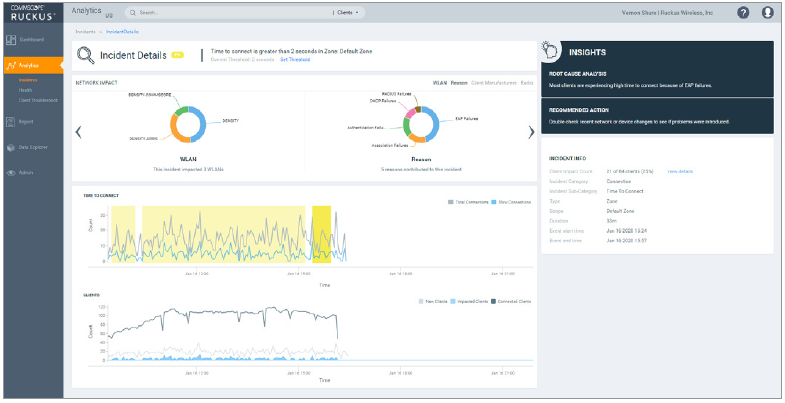
RUCKUS Analytics provides a root cause analysis of each service incident with specific recommendations for how to resolve the issue.
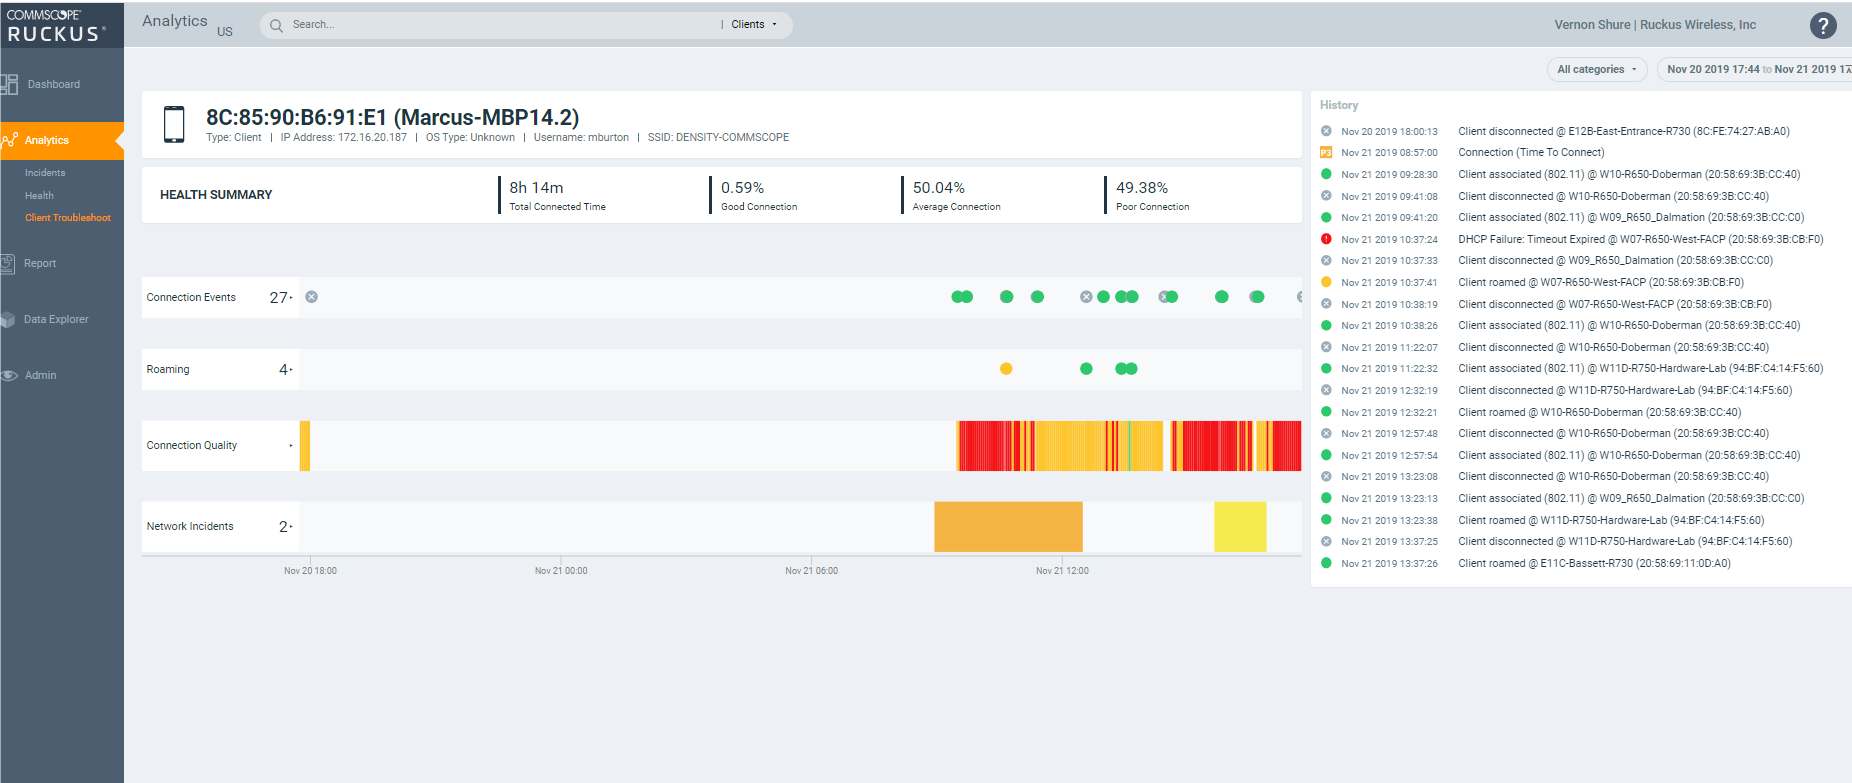
Powerful Client Troubleshooting
With simple and flexible search and a holistic client troubleshooting page, RUCKUS Analytics gives you a complete picture of client experience for easy connectivity and user experience diagnostics, including:
- Successful, slow and failed connections
- Disconnect events
- Roaming events and failed roams
- Connection quality (RSSI, MCS, client throughput)
- Network incidents affecting users, with links to see incident details
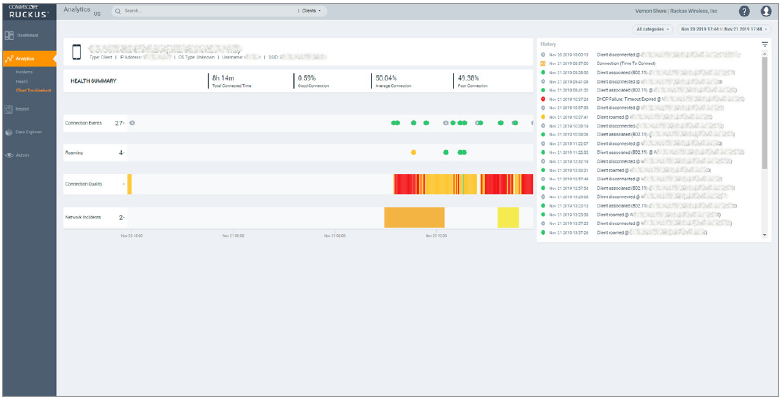
Advanced client troubleshooting lets you investigate and resolve issues
that have impacted a specific client on the network.
Prepackaged Reports and Dashboards
A wide variety of standardized reports provides visibility into network performance, traffic patterns, application usage and more. Summary views provide high-level information, and you can drill down to the level of individual network components and devices. Examples of standardized reports include:
- Network-traffic and client trends, top devices, top SSIDs, traffic distribution and more
- Client-reports by OS and device manufacturer, top clients by usage, client trends, session details and more
- Inventory-AP, switch and controller count, models, firmware, status, and more
- Application-top apps and their usage trends, top app groups and usage, top ports and more
- Device-specific reports-complete visibility and usage reports for clients, APs and switches
The service lets you download reports as raw data, a PDF file or a CSV file. Forward the results to stakeholders inside or outside the organization.
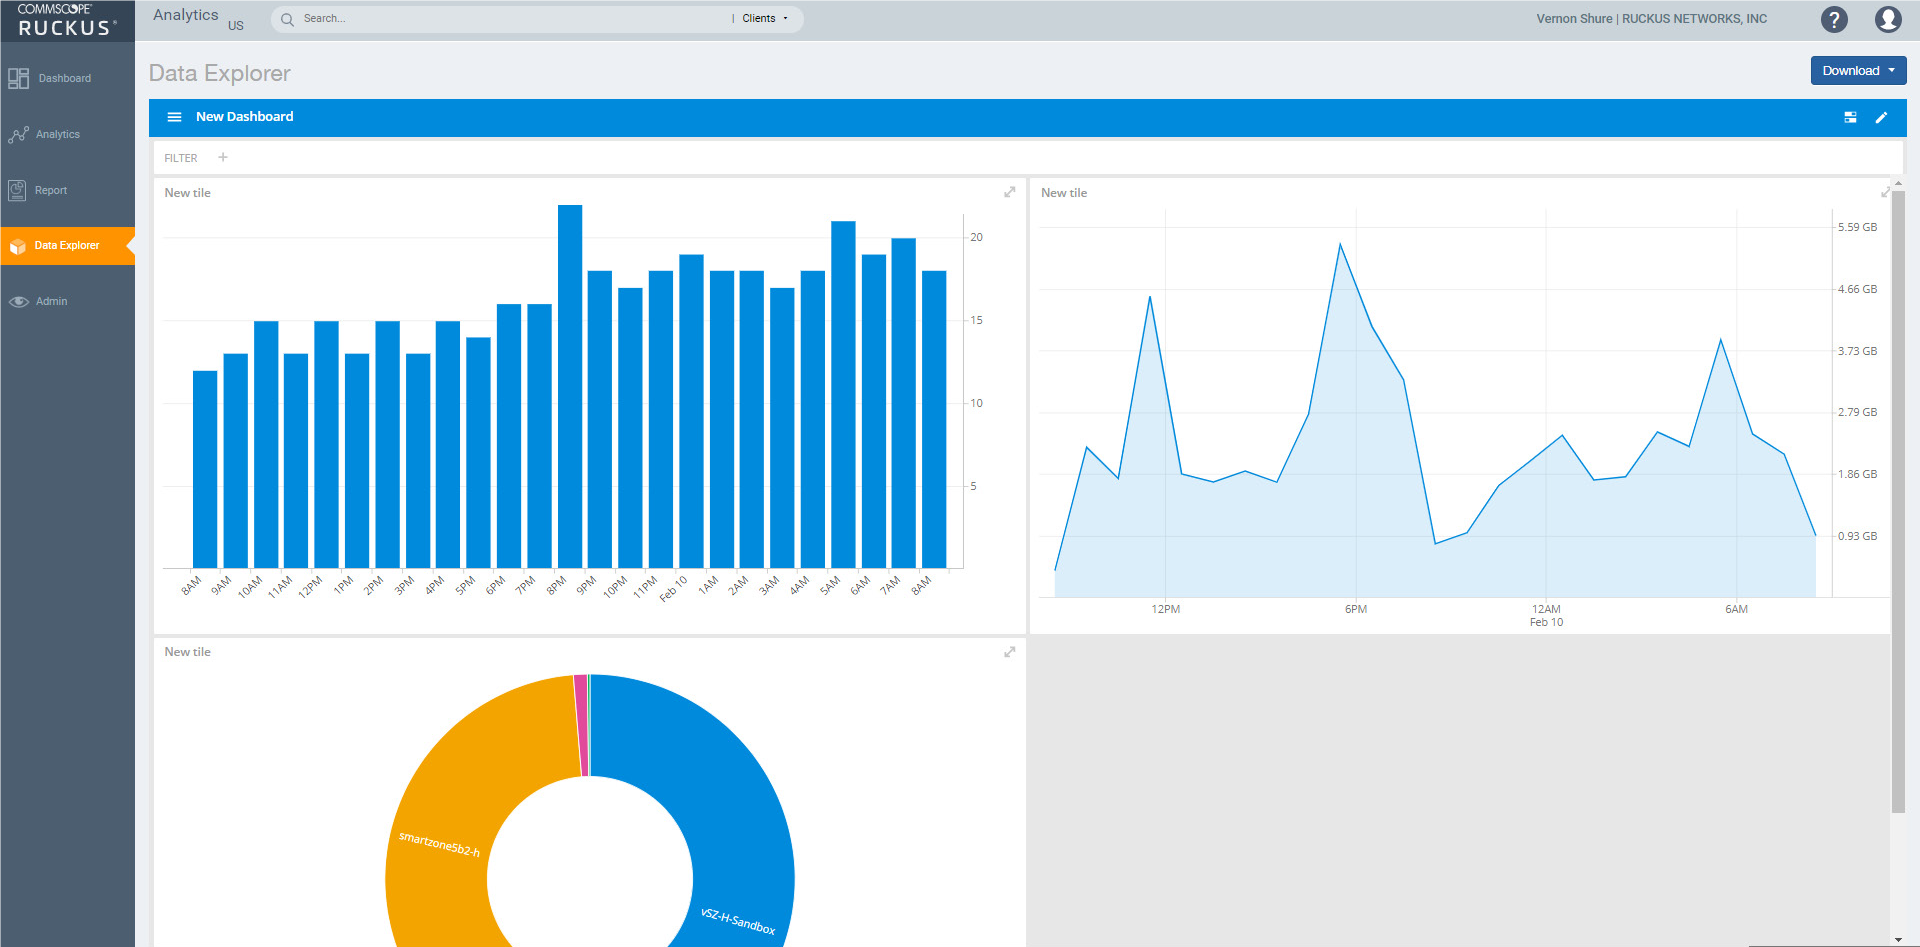
Customizable Dashboards with Data Explorer
The RUCKUS Analytics Data Explorer tool lets you create customized dashboards to dissect and analyze data from your network ecosystem. Drag-and-drop dashboard creation makes it easy to design views tailored to your needs. You can easily position and reposition dashboard tiles, edit tiles at will, and toggle between different views.
Analyze and filter data by dozens of dimensions-including time, device type, traffic type, application, AP group, controller, access point, band, SSID and more. Use multiple visualization methods to view your data, including pivot tables, line charts, bar charts, sunbursts, sankey diagrams, stacked charts and heat maps. Data Explorer puts your full data warehouse at your fingertips so that you can answer any number of network questions.
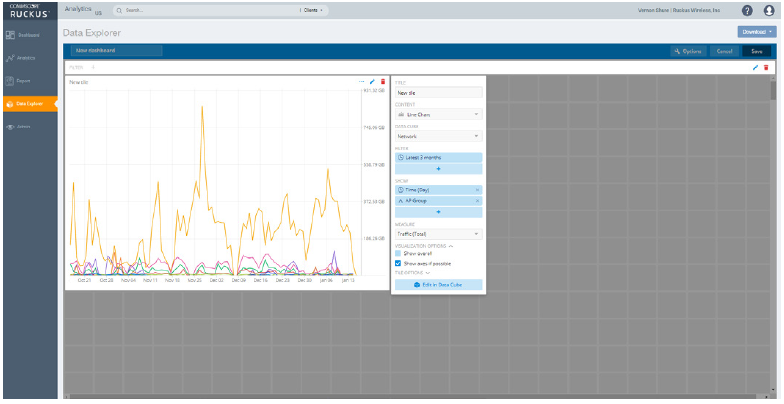
The Data Explorer tool in RUCKUS Analytics lets you create custom dashboards with drag-and-drop ease.
Cloud Deployment for Scalability and Expandability
As a hosted service, RUCKUS Analytics relieves you of the burden of managing an in-house network analytics platform. Because the system stores data in the cloud, capacity is virtually limitless and expands instantly as your network environment generates more data. You don't have to worry about running out of capacity, forecasting disk utilization or figuring out when to add resources. RUCKUS Analytics does that for you transparently using containers and microservice orchestration. The software does not require an on-site data collector.
Benefits:
RUCKUS Analytics aggregates raw data and automatically transforms it into deep insight into network operations. This MLand AI-powered analytics service frees you from a wide variety of manual tasks associated with network assurance. Comprehensive network intelligence helps you deliver on network SLAs in support of users, devices and applications.
RUCKUS Analytics automatically measures the impact of SmartZone configuration changes on network performance. You can observe the effects of each change on a portion of the network before rolling it out more broadly. This helps to avoid fully rolling out changes that might have an adverse effect on network performance.
It scales to support the largest deployments—expanding capacity transparently to meet your requirements. RUCKUS Analytics supports two control and management architectures: SmartZone* for on-premises and private cloud/data center deployments, and RUCKUS Cloud for cloud-managed deployments.
Benefits include:
- Provides comprehensive visibility into network operations
- Accelerates network and client troubleshooting
- Identifies, prioritizes and recommends remediation steps for service issues
- Helps IT teams improve the user experience
- Works with your RUCKUS network to automatically validate service levels
Use Cases:
Advanced Client Troubleshooting
Lets you investigate and resolve issues that have impacted a specific client on the network.
Data Explorer
The Data Explorer tool in RUCKUS Analytics lets you create custom dashboards with drag-and-drop ease.
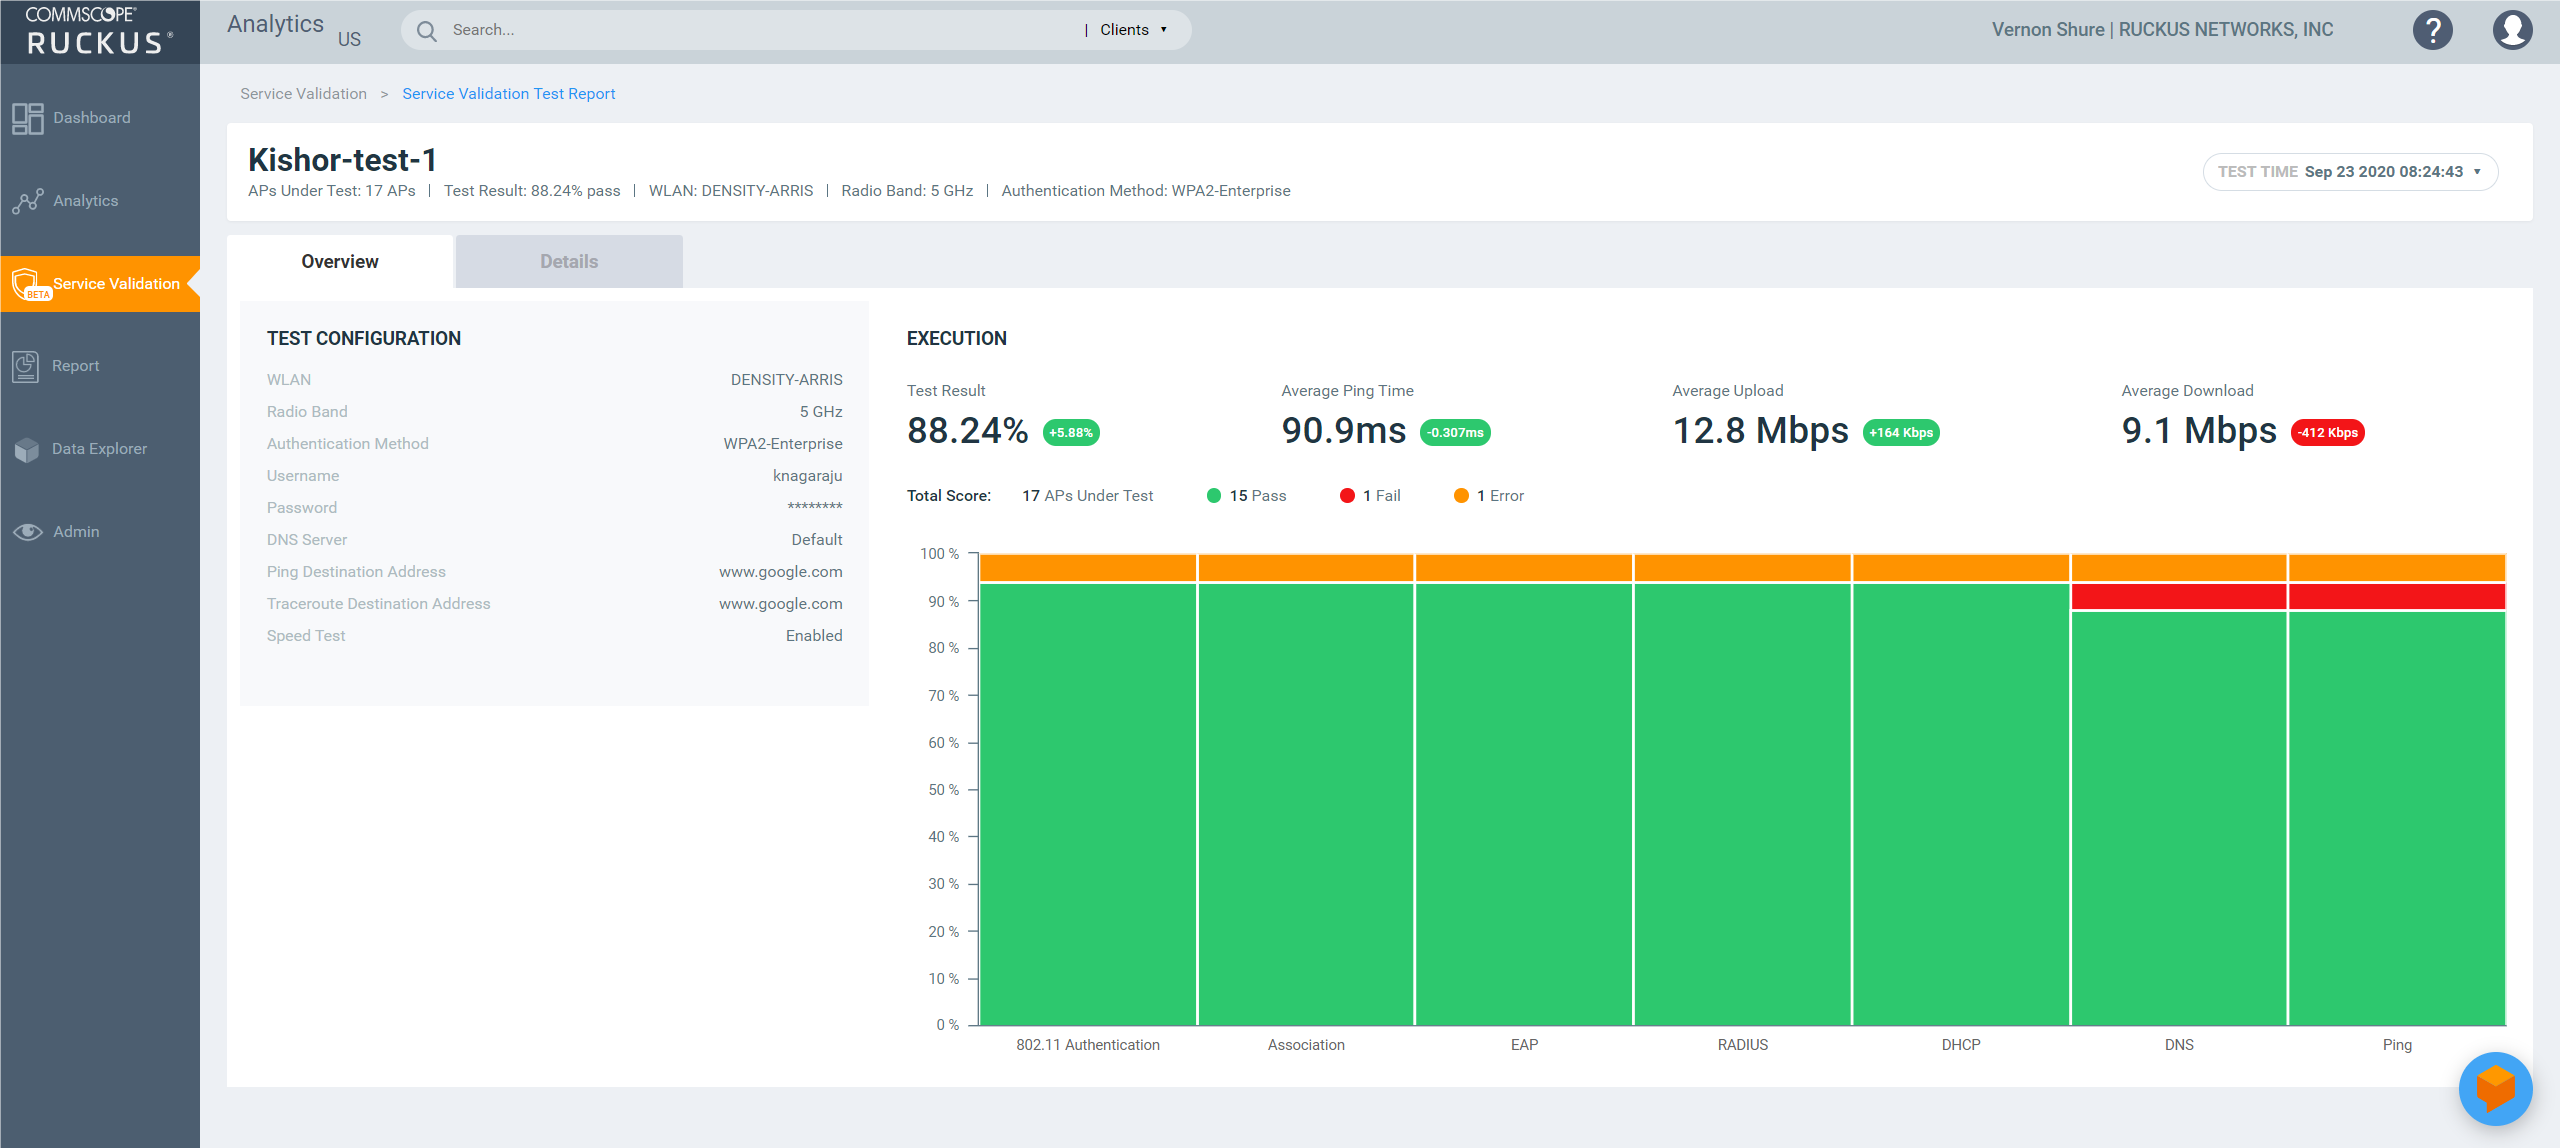
Service Validation
RUCKUS Analytics works with your RUCKUS network to allow the network to automatically validate network service levels.
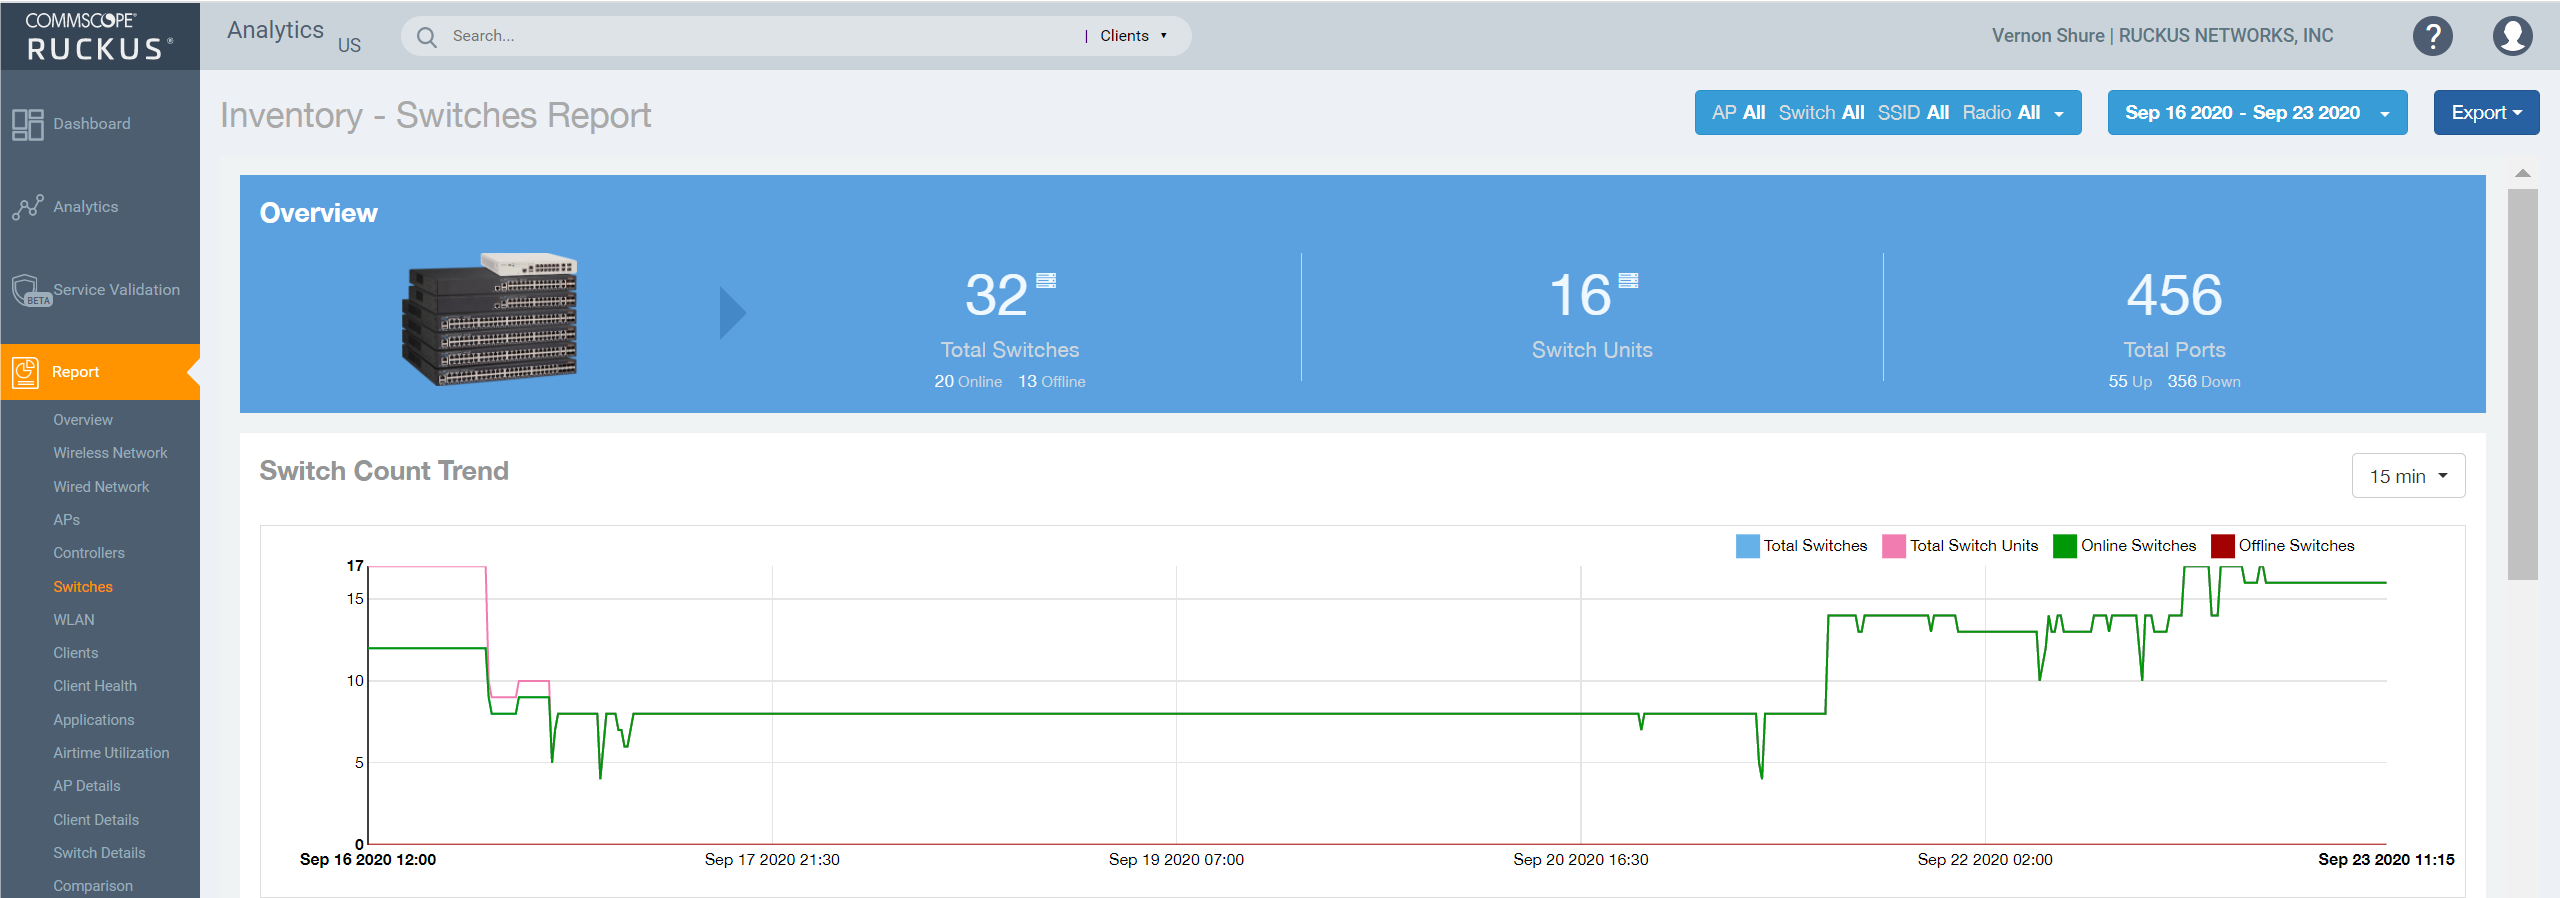
Reporting
RUCKUS Analytics includes a wide variety of pre-packaged reports. This report shows metrics related to the RUCKUS switches in the network.
Documentation:
Download the RUCKUS Analytics Datasheet (.PDF)
RUCKUS Analytics Subscription for 1 AP
Our Price: Request a Quote
RUCKUS Analytics Subscription for 1 AP
Our Price: Request a Quote
RUCKUS Analytics Subscription for 1 AP
Our Price: Request a Quote
RUCKUS Analytics Subscription for 1 AP
Our Price: Request a Quote
RUCKUS Analytics Subscription for 1 AP
Our Price: Request a Quote
RUCKUS Analytics Subscription for 1 AP
Our Price: Request a Quote
Need help? Chat with an industry expert right now!
Please fill out the form below or call us at (02) 9388 1741
Contact Us
Sydney Office:
NetWifi.com.au
A division of Virtual Graffiti Australia Pty Ltd
Darlinghurst, NSW, 2010
Australia
Telephone:
- Local: (02) 9388 1741
- International: +612 9388 1741
[email protected]
Normal Business Hours:
- Mon - Fri, 8:30am - 6:00pm AEST/AEDT
Our team is here to help you! We are available from Mon - Fri, 8:30am - 6:00pm AEST/AEDT and attempt to respond to all inquiries within 1 business day.
Please Note: Technical support is provided by the manufacturer. If you have a product support related questions, please contact the manufacturer directly.